
Data Biographies: A Tool for Integrating Real-World Data into Classrooms
Although vast public data repositories exist, locating, cleaning, and contextualizing real-world data remains a significant barrier for many educators. This article introduces Data Biographies, a free collection of curated datasets and support materials designed to help middle and high school teachers engage students in meaningful data exploration.
Continue Reading Data Biographies: A Tool for Integrating Real-World Data into Classrooms
Spotlight

The ‘Perfect’ Regression: A Device for Demonstrating Spuriousness and Overfitting
Misinterpretation of regression results—particularly confusion between correlation, causation, and predictive power—remains a challenge in statistics education. This paper introduces the “perfect” regression as a pedagogical device for illustrating spurious correlation and overfitting.
Continue Reading The ‘Perfect’ Regression: A Device for Demonstrating Spuriousness and Overfitting

Graphing with Kids: Teaching the Superpower of Numbers and Data
Imagine a world in which numbers and data come alive to solve problems, spark curiosity, and tell captivating stories. This is the world of Daphne, the data-drawing dragon. Daphne thrives on transforming everyday questions into exciting adventures, using graphs and data to uncover answers and share discoveries.
Continue Reading Graphing with Kids: Teaching the Superpower of Numbers and Data

On the Pedagogy of Randomness: Effectively Teaching How Random Is Relative in High School
The authors argue that prominently including the idea that randomness is relative to the observer in statistical education pedagogy is important to support practical comprehension on why and how statistical tools work.

Integrating Data Science Practices into Informal Learning: A STEM Summer Camp Approach
This article offers a model for integrating accessible, equity-minded data science activities into informal learning programs. Readers will gain insights into practical strategies, adaptable lesson structures, and evaluation approaches they can apply to diverse educational contexts to inspire and prepare students for data-rich futures.

Some Paradoxes: Puzzling or Poorly Presented?
This article explores the use of statistical paradoxes—specifically the Will Rogers Phenomenon, Simpson’s Paradox, False Positive Paradox, and the Birthday Problem—as teaching tools for middle and high school students.
Continue Reading Some Paradoxes: Puzzling or Poorly Presented?

ASA/NCTM Joint Committee Members Share Favorite Resources, Ideas
ASA/NCTM Joint Committee Members Share the July episode of “Adding It All Up” and thoughts about the power of hallway collaborations.
Continue Reading ASA/NCTM Joint Committee Members Share Favorite Resources, Ideas
lesson plans
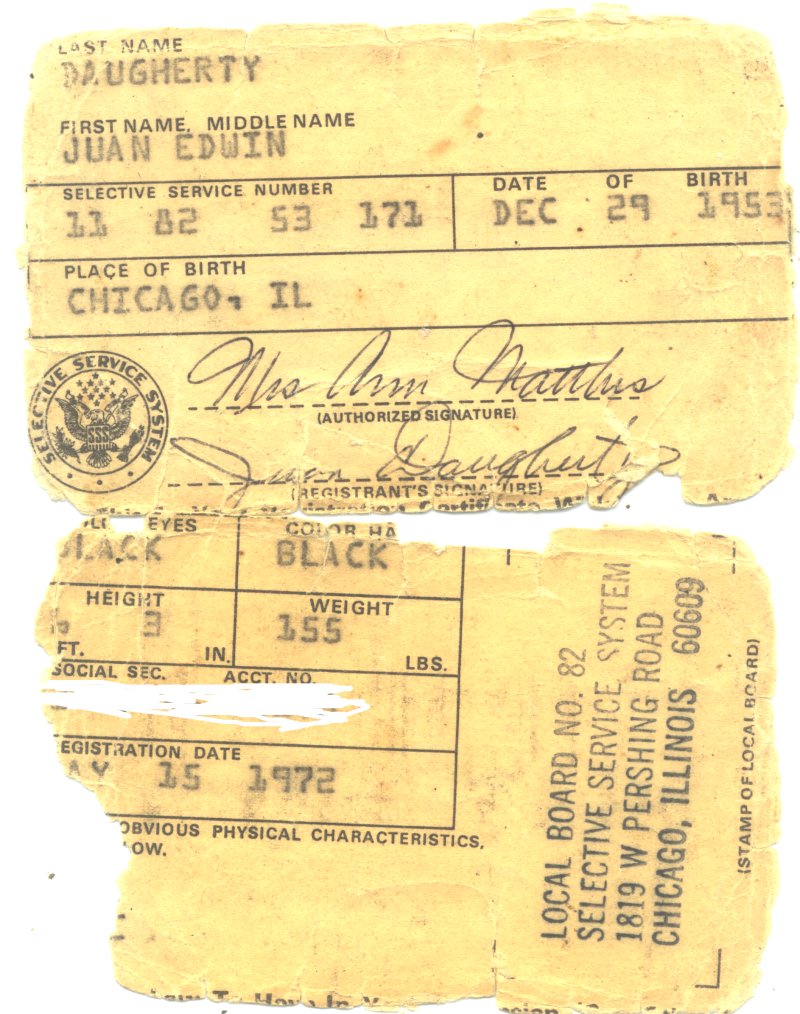
Lesson Plan: Vietnam War Draft Probability Exploration
In this lesson, students explore actual data from the 1969 Vietnam War Draft, which was used as a way for the Selective Service to prove to the United States public that the draft was a truly random way to choose who would be chosen to serve. But how truly random was it?
Continue Reading Lesson Plan: Vietnam War Draft Probability Exploration

Lesson Plan: Sticky Note Statistics
By Joanne Caniglia, Kent State University Overview of Lesson This set of activities allows students…

Lesson Plan: Educational Level Implications on Careers in Statistics (ELICS) for Undergraduate Students
By Christina M. Wood-Wentz, Mayo Clinic, and Heather Cook, University of Southern Indiana Overview of…